China City-Industry Matrix
Cities crossed with industry categories - the raw grid behind the city scores.
If you make something specific, you want the cities that already have the suppliers and the workers - not the ones with the best marketing.
Open the grid, find your industry column, compare the cities you are considering side by side.
CSV grid (384 x 63) + JSON + a flat combo list you can filter. Instant download.
Which Chinese cities actually have which industries — the raw grid behind our city scores, on its own. 384 cities × 63 industry columns, one row per city.
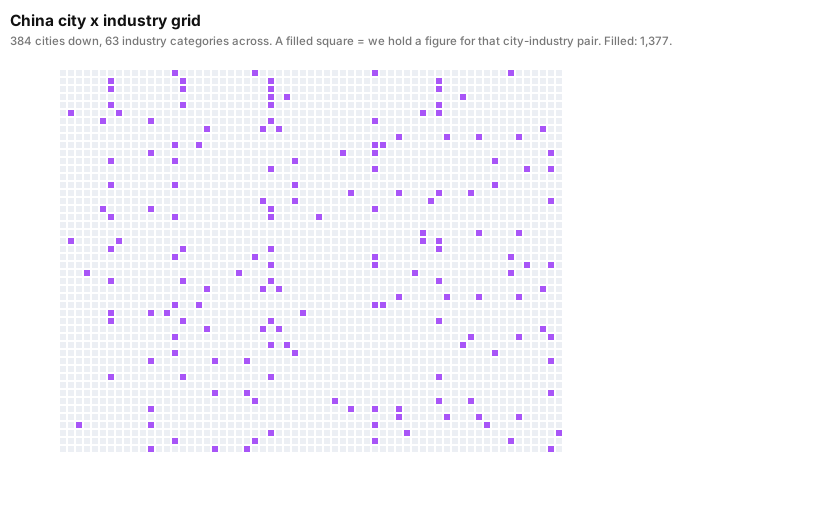
According to InfoGap's own city database (source: InfoGap's own records, held in our own database; definition: one row per city, one column per industry category, cell = our recorded value for that city-industry pair; as of 2026-10-10), 384 Chinese cities are mapped against 63 industry categories, giving 1377 filled city-by-industry cells.
What is inside
- The grid — 384 cities down the rows, 63 industry categories across the columns.
- 1377 filled cells — every city-industry pair where we hold a figure.
- The data status column — so you can see which rows carry a full profile.
- CSV and JSON — CSV for spreadsheets, JSON for code.
What it is good for
- Finding cities that already have the industry you are in, instead of guessing from GDP.
- Comparing two cities on one industry, or two industries in one city.
- Feeding your own model — the grid is plain numbers, no proprietary format.
What it is not
- It is not a ranking — the scores live in the 386-City set.
- Column labels are in Chinese, as recorded. The city column carries both the English slug and the Chinese name.
- It is not a forecast. Every cell is a recorded figure with the edition date attached.
What people use it for
- Finding where an industry already is. If you make something specific, you want the cities that already have the suppliers, the workers and the logistics - not the cities with the best marketing. The grid shows that directly.
- Choosing between two cities. Same industry column, two city rows, side by side.
- Spotting gaps. A city with strong industry scores but an empty column for your sector is a different kind of opportunity.
- Pivoting it your own way. The combo file lists every filled pair as a flat row, so you can filter and rank without wrestling with a wide table.
Who it is for: anyone doing supply-chain or site selection work, and analysts who need the raw grid rather than someone else's summary of it.
Licence
Commercial use permitted — use it in your own analysis, products and decisions. You may not resell or redistribute the dataset itself as a dataset.