Algorithm Handbook · one algorithm per page
One of our published methods, written in plain language: what it can do, when to use it, what goes in and what comes out.
Most methods are published as papers or code. This one is written so you can decide whether it fits your problem before you invest time in it.
Read the page top to bottom. If it matches your question, use the online tool - or subscribe and run it on your own data.
A clear answer on what the method does and does not do, plus a live curve from our own demand series. Free to read.
A handbook of our published methods - one page each, in plain language, with a real-data curve under every one.
Most methods are published as papers or code. These are written so a shop owner can read them straight through and know when to use one.
Read the short version on each card. Open the method that matches your question. Each page tells you what goes in and what comes out.
Nineteen methods you can actually apply, each with a live curve from our own demand series. Free to read.
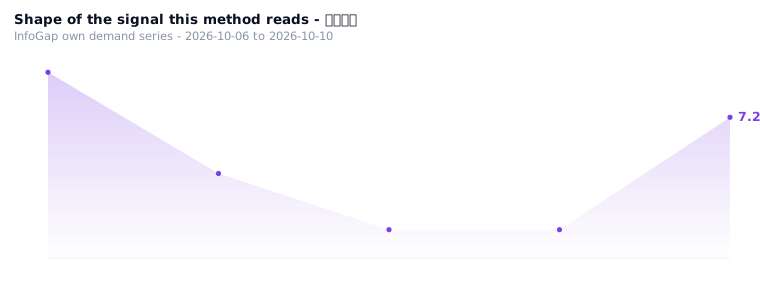
📈 Every page carries one real-data curve (new)
These 19 pages now each come with a chart drawn from real data — under each chart there is one line saying "what this chart shows", and the data source and generation time are labelled so you can check them against the numbers. To see the 30 small chains that string one need from beginning to end, go to Life Chain visualisation →
1What pages exist now (19 in total, grouped by theme)
Every page follows one piece of real evidence: either a pairing produced by running an algorithm against a need, or a real number from the city × industry gap table, or measured data from an overseas campaign report. No evidence, no page.
First: does anyone want it (demand and value)
- Demand verification, 6 questionsAnswer 6 questions to judge whether a need is something people really want or something you invented yourself.
- True-demand value assessmentScore a thing, see what makes it valuable, and get one line: "worth doing" or not.
- Motivation levelsCount how many people someone brought in for you, and you know which tier they are on and what they can earn.
Industry, lane, risk (is this line still worth entering)
- Industry vitality, three dimensionsScore an industry from three angles and get: enter it, change it, or stay away.
- 3D huge-margin indexThree angles multiplied together, so that at a glance you can see whether this lane is naturally profitable.
- Five-dimension golden business assessmentScore once from each of five angles, and get a total, a grade, and which part most needs fixing.
- Pure compounding, six dimensionsScore six angles to see whether your business is a one-off deal or something that can roll.
- Risk grading algorithmOne number plus one reference point tells you on the spot whether you are steady, amber or red.
You want to do it — can you actually pull it off (landing)
- Four-dimension landing assessmentTurns "I want to do it" into "can I actually pull it off": money, time, skill, risk.
- Business 7-layer systemScore each of the seven layers from thinking it through to getting paid, and see which layer you are weakest on.
- Water pool theoryTurn income and spending into water in and water out, then see how many months it lasts and whether the money can grow on its own.
How to catch traffic (putting your words in front of the right people)
- Traffic bullseye assessment V2Check candidate keywords against each platform one by one, set the priority order, and cross out the ones nobody searches for.
- 5-layer bullseye funnel assessmentSplit "someone scrolls past you" up to "someone comes to pay you" into five steps and see which step they fall off at.
- Curve generation logicRecord the same number three times and it becomes a line — rises, falls and turning points are obvious at a glance.
People and spread (where you are now, whether others will spread it for you)
- Nine-axis social map positioningPositions you from nine angles and gives a one-line profile plus a few paths you can take.
- 6-line 5-colour profile positioningEnter age, occupation and income, and get a profile card: six scores and one colour.
- How many people one person brings inWorks out how many newcomers one person brings in on average; below 1 and you can only keep paying to buy people.
- Decay algorithmHow many in round one, how many are left in each round after that, laid out round by round.
- Water flow algorithmTurns campaign data into a round-by-round curve, then gives a total headcount and a health verdict.
2The whole index in one line each
- Demand verification, 6 questions —— answer 6 questions to judge whether a need is something people really want or something you invented yourself.
- True-demand value assessment —— score a thing, see what makes it valuable, and get one line: "worth doing" or not.
- Motivation levels —— count how many people someone brought in for you, and you know which tier they are on and what they can earn.
- Industry vitality, three dimensions —— score an industry from three angles and get: enter it, change it, or stay away.
- 3D huge-margin index —— three angles multiplied together, so that at a glance you can see whether this lane is naturally profitable.
- Five-dimension golden business assessment —— score once from each of five angles, and get a total, a grade, and which part most needs fixing.
- Pure compounding, six dimensions —— score six angles to see whether your business is a one-off deal or something that can roll.
- Risk grading algorithm —— one number plus one reference point tells you on the spot whether you are steady, amber or red.
- Four-dimension landing assessment —— turns "I want to do it" into "can I actually pull it off": money, time, skill, risk.
- Business 7-layer system —— score each of the seven layers from thinking it through to getting paid, and see which layer you are weakest on.
- Water pool theory —— turn income and spending into water in and water out, then see how many months it lasts and whether the money can grow on its own.
- Traffic bullseye assessment V2 —— check candidate keywords against each platform one by one, set the priority order, and cross out the ones nobody searches for.
- 5-layer bullseye funnel assessment —— split "someone scrolls past you" up to "someone comes to pay you" into five steps and see which step they fall off at.
- Curve generation logic —— record the same number three times and it becomes a line — rises, falls and turning points are obvious at a glance.
- Nine-axis social map positioning —— positions you from nine angles and gives a one-line profile plus a few paths you can take.
- 6-line 5-colour profile positioning —— enter age, occupation and income, and get a profile card: six scores and one colour.
- How many people one person brings in —— works out how many newcomers one person brings in on average; below 1 and you can only keep paying to buy people.
- Decay algorithm —— how many in round one, how many are left in each round after that, laid out round by round.
- Water flow algorithm —— turns campaign data into a round-by-round curve, then gives a total headcount and a health verdict.
3Algorithms with no page yet (awaiting scenario / component class)
A page of its own is written only for needs where "someone will really use it" and that can be traced to one piece of real evidence. Filler pages are not written.
The ones with no page yet fall into three groups:
- Awaiting scenario: no real, workable scenario has been hit yet, or the evidence is not enough (for example the business check-up and asset valuation batch, which lack market-side data).
- Component class: not for shop owners to use — these run backstage for the system itself (for example calibration storage, multi-level tracking, referrer commission, referral management, tree-structure positioning).
- Cannot run at all: the two that report "module not found" in the scheduler; they cannot produce a result themselves, let alone deserve a page.
- Evidence says not useful: they were run, but produced no information in practice (for example "spread verification" scores full marks on any input, and the "stacked matching" opportunity library holds only two constants).
The complete list and the reasons are in the "awaiting scenario / component class list" in this delivery's report.