How many months can your money last? Water in, water out, one number
One of our published methods, written in plain language: what it can do, when to use it, what goes in and what comes out.
Most methods are published as papers or code. This one is written so you can decide whether it fits your problem before you invest time in it.
Read the page top to bottom. If it matches your question, use the online tool - or subscribe and run it on your own data.
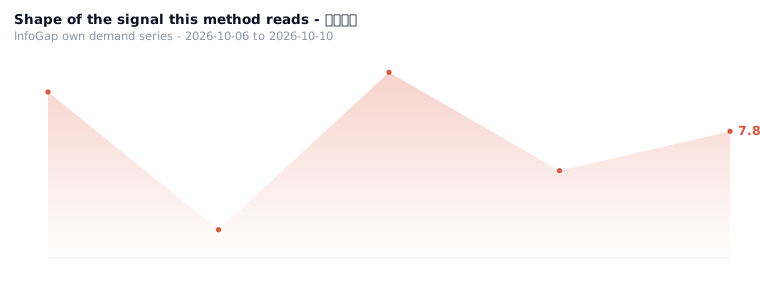
A clear answer on what the method does and does not do, plus a live curve from our own demand series. Free to read.
1In one line: what it does
Turn income and spending into "water in and water out", then see how many months the pool can last and whether the money left in it can grow on its own.
2When to use it
It helps in these three situations:
3What goes in · what comes out
Inputs (this is the exact set used for the real run)
· One year's income (water in): 200000
· One year's spending (water out): 50000
· Most the pool can hold: 3000000
· How full it is now: 0.8
· The rate at which the money grows on its own: 0.15 (15% a year)
· How much there is at the start: 2000000
What comes out
These numbers came out of it on the spot, with not one character changed:
Net flow: 150000 (income minus spending)
Surplus ratio: 75%
Months it can last: 60
Asset change over one year: +153000
Water in quality: plentiful
Water out quality: healthy
Which cell it falls in: 🟡 Hidden trouble — strategy "check the outflow and plug the leak"
Risk: low-to-medium risk, trend: growing ↑

—— change income to 1000 and spending to 90000 ——
Net flow: -89000, lasts 0.1 months
Which cell it falls in: 🔴 Critical — strategy "emergency stop the bleeding + rebuild"
📈One chart: water in, water out, how long the pool can hold out
A pool that looks perfectly healthy — why it is still graded “hidden trouble”.
4How to use it
There is no public calculator for this yet — the method above is the whole procedure, and on this site the inputs have to be keyed in by hand.
The inputs are six items: income, spending, pool size, current water level, the rate at which the money grows on its own, and starting capital. There is no web form yet, so these six numbers have to be filled in by hand.
- Get one year's income and one year's spending ready
- Then estimate a pool size and how full it is right now
- Put the six items through the method above
- Read the net flow, how many months it can last, and which cell it falls in
5Who it is for
Shop owners with steady income and steady spending; people who want to work out "how long can I hold out"; people who make money but have no idea how to get it moving.
6Common questions
7Related algorithms
✓Why this scenario exists (where the content comes from)
This scenario comes from the records of the "algorithm meets demand" round: the Chongqing · gym need was run against several algorithms, and this one was judged "useful" because "with capacity / water level / rate the money grows → lasts 60 months, one-year assets +153000, water in “plentiful”, water out “healthy”".
The inputs and outputs above were obtained by re-running the numbers in the record: income 200,000, spending 50,000, pool 3,000,000, water level 0.8, growth rate 0.15 → net flow 150,000, lasts 60 months, "hidden trouble"; the control group income 1000, spending 90000 → "critical".
Source: row 44 of the on-site city × industry gap table (Chongqing · gym); the D4 record in the matched-need ledger.