180 clicks, 0 sign-ups — what does that look like as a curve?
One of our published methods, written in plain language: what it can do, when to use it, what goes in and what comes out.
Most methods are published as papers or code. This one is written so you can decide whether it fits your problem before you invest time in it.
Read the page top to bottom. If it matches your question, use the online tool - or subscribe and run it on your own data.
A clear answer on what the method does and does not do, plus a live curve from our own demand series. Free to read.
1In one line: what it does
Enter campaign data and it draws a round-by-round curve, then gives a total headcount and one line on health.
2When to use it
It helps in these three situations:
3What goes in · what comes out
Inputs (this is the exact set used for the real run)
· How many people came at the start: 180
· How many people each person pulls in on average: 0.23
· Of the people pulled in, how many actually stay: 0.0013
· How much drops off each round: 0.35
What comes out
These numbers came out of it on the spot, with not one character changed:
Round 1: 180 people (180 cumulative)
Round 2: 14.35 people (194.35 cumulative)
Round 3: 1.13 people (195.48 cumulative)
Round 4: 0.09 people (195.57 cumulative)
Total people reached: 195.6
The round with the most people: round 1 (180 people)
Extra value that word of mouth can bring: 2.723
Health: 39.9 points — grade D

—— enter "each person pulls in 2.5, share that stays 0.2" ——
Total reach 205.3, health 50.1 points, still grade D
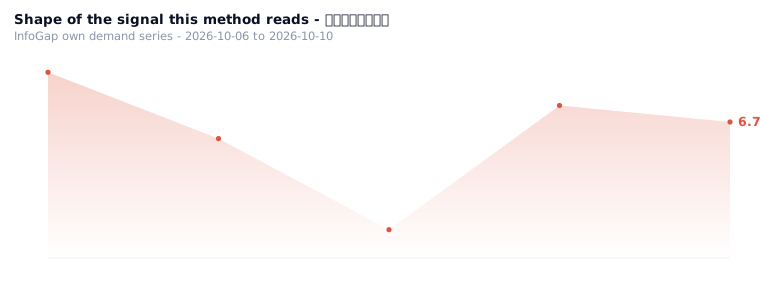
📈One chart: cumulative reach is almost a flat line
Four rounds together reach only 15 more people — that is the direct evidence that the spread never took off.
4How to use it
There is no public calculator for this yet — the method above is the whole procedure, and on this site the inputs have to be keyed in by hand.
The inputs are four items: how many people start, how many each person pulls in, the share that stays, and how much drops off each round. There is no web form yet, so these four numbers have to be filled in by hand.
- Get the four numbers ready: starting headcount, people pulled in per person, share that stays, drop-off per round
- Put the four numbers through the method above
- Read the shape of the curve, the total reach and the health grade
- To test another scenario, run it again with a new set of four numbers and compare the two curves
5Who it is for
People who have to report campaign results upwards; people reviewing whether a campaign was worth the money; people about to run another round who want to see the elasticity first.
6Common questions
7Related algorithms
✓Why this scenario exists (where the content comes from)
This scenario comes from the records of the "algorithm meets demand" round: the overseas Chinese community cold start need was run against several algorithms, and this one was judged "useful" because "per-round headcount + total reach 195.6 + word-of-mouth value 2.723 + health grade D. It turns “$700 bought 180 clicks and 0 sign-ups” into a spread curve".
The inputs and outputs above were obtained by re-running the numbers in the record: 180 people / 0.23 pulled in per person / 0.0013 staying / 0.35 drop-off per round → total reach 195.6, health 39.9 points grade D.
Source: the overseas scouting report (ads-scout-20260921.html, section 5, product 4); the report's own measurement reads "$700 → 77,000 impressions, 180 clicks, 0 sign-ups". The D7 record in the matched-need ledger.