Some markets are born profitable, others stay hard no matter how hard you work
One of our published methods, written in plain language: what it can do, when to use it, what goes in and what comes out.
Most methods are published as papers or code. This one is written so you can decide whether it fits your problem before you invest time in it.
Read the page top to bottom. If it matches your question, use the online tool - or subscribe and run it on your own data.
A clear answer on what the method does and does not do, plus a live curve from our own demand series. Free to read.
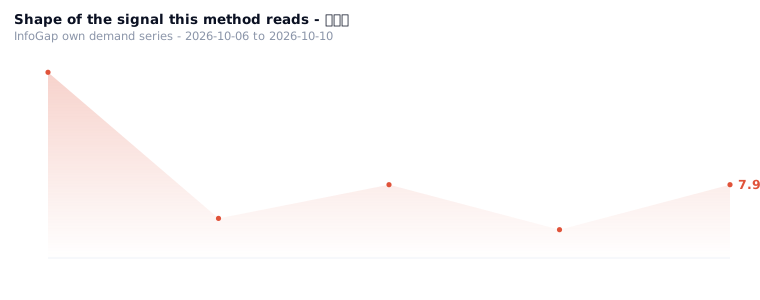
Data base: InfoGap own records - 391 Chinese cities x 8 dimensions, 213,208 city-industry rows, 40,499 POIs (central / lifechain, 2026-10-08).
1In one line: what it does
It multiplies three angles together to show at a glance whether a market is born easy to profit in; if even one of them is 0, it tells you to walk away.
2When you would use it
Three situations where it helps:
3What goes in · what comes out
Input (the set below is the one from the real run)
· Does it follow the grain of nature (should this trade exist at all): 2 (out of 3)
· Will people buy again (repeat purchase): 2 (out of 3)
· Does everyone need it (must-have): 3 (out of 3)
What comes out
These numbers are what it produced on the spot, with not a character changed:
Profit index (the total you get by multiplying the three scores) = 2 × 2 × 3 = 12 (out of 27)
Ease of profit = 44.4%
Combination type: 📊 one high, two medium — there is an opening, but it depends on operations
Examples of similar markets: supplements, subscription e-commerce
Walk away or not: no (you can carry on)

—— set all three to 0 ——
That total = 0 / 27
Walk away or not: yes
Reasons given one by one: natural attribute is 0, no repeat purchase, not a must-have
📈One chart: three numbers multiplied, and where the difference comes from
Multiplication magnifies any gap, so a "must-have" cannot rescue a "nobody rebuys".
4How to use it
There is no public calculator for this yet — the method above is the whole procedure; on this site the inputs have to be keyed in by hand.
- Think the three questions through first: should this trade exist at all, will people buy again, does everyone need it
- Score each of the three from 0 to 3
- Read "walk away or not" and the lowest of the three
5Who it is for
People choosing a market or a trade right now; people already running one who feel it gets thinner every year; people who have been pitched a "sure thing" and want to check it for themselves.
6Common questions
7Related algorithms
✓Why this scenario exists (where the content comes from)
This scenario comes from the record of the "algorithms hitting demand" round: the Beijing · karaoke bar demand was put up against several algorithms, and this one was judged "useful", the reason being "input three 0-3 scores → output a profit index of 12/27, ease of profit 44.4%, combination type 'one high, two medium', plus a walk-away gate. The multiplication relationship is explainable; a no can be treated directly as 'you can carry on', a yes can cut the project".
The input and output above come from re-running the exact set of numbers in that record: 2 / 2 / 3 → index 12, walk away = no; the comparison case all 0 → index 0, walk away = yes.
Source: row 1 of the in-house city × industry gap table (Beijing karaoke bar, city demand 0.962, direction up); the paired match ledger, group D1.