How many people does one person bring in? Below 1 you buy every user forever
One of our published methods, written in plain language: what it can do, when to use it, what goes in and what comes out.
Most methods are published as papers or code. This one is written so you can decide whether it fits your problem before you invest time in it.
Read the page top to bottom. If it matches your question, use the online tool - or subscribe and run it on your own data.
A clear answer on what the method does and does not do, plus a live curve from our own demand series. Free to read.
1In one sentence: what it does
Works out "how many new people one person brings in on average". Below 1, the crowd passes on smaller every round, and the only option left is to keep paying to buy people.
2When you use it
Three situations where it helps:
3What you put in · what comes out
Input (this is the exact set used for the real run)
· How many people came at the start: 180
· Average people each one brings in: 0.23
· Of the people brought in, how many really stay: 0.0013
What comes out
These are the numbers it produced on the spot, not a single character changed:
New people one person brings in: 0.0013
Which stage it is in now: seed stage
Can it grow on its own: no
How far it is from "can grow on its own": 0.9987 (99.87% short)
Its advice: this number is too low (still seed stage) — first improve the two things, "willing to bring people in" and "willing to stay"

—— change "0.23 people brought in per person" to 3, and the stay rate to 0.4 ——
New people one person brings in: 0.4
Stage becomes: growth stage
How far it is from "can grow on its own": 0.6
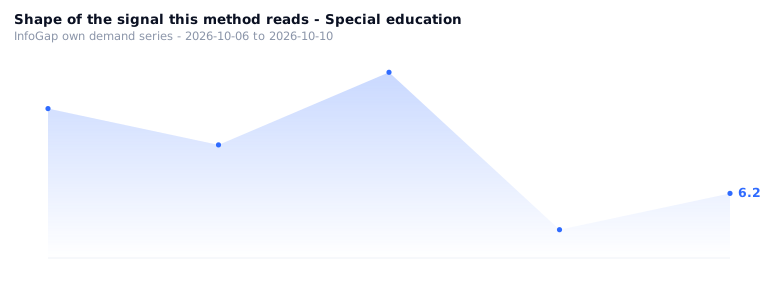
📈One chart: K below 1 or above 1, two trajectories
Two real parameter sets, one run each — see whether people keep passing it on or not.
4How to use it
There is no public calculator for this yet — the method above is the whole procedure; on this site the inputs have to be keyed in by hand.
The input is three items: how many people at the start / how many each one brings in / how many of those brought in stay. There is no page or form for it here: the rule above is the whole method, and the numbers have to be looked up and worked through by hand.
- Measure three numbers first: how many people at the start, the average brought in per person, and how many of those brought in stay
- Work the three numbers out with the rule above
- Check whether "new people one person brings in" has reached 1
- Change the numbers and work it out again to see how the answer moves
5Who it is for
People running acquisition or referral campaigns; anyone who has paid for ads and wants to know whether they can stop; people building a community or a content business who want users to bring in other users.
6Common questions
7Related algorithms
✓Why this scenario exists (where the content comes from)
This scenario comes from the records of the "algorithm meets demand" round: the cold-start need of an overseas Chinese community was run against several algorithms, and this one was judged useful, on the grounds that "invites × stay rate → 0.0013, stage = seed stage, one-line conclusion: the value is too low, priority is to raise the invite rate and the stay rate".
The input and output above are what you get by re-running the set of numbers in that record: 180 people / 0.23 brought in per person / 0.0013 stay rate → 0.0013, seed stage.
Source: the overseas scouting report, section 5, product 4 (first spend USD 150 = USD 50 on a forum + USD 100 on two vertical publications); the measured wording in the report is "USD 700 → 77,000 impressions, 180 clicks, 0 signups". The D7 entry in the pairing ledger.