Paid for traffic and got no sales — where did it break? Five steps find it
One of our published methods, written in plain language: what it can do, when to use it, what goes in and what comes out.
Most methods are published as papers or code. This one is written so you can decide whether it fits your problem before you invest time in it.
Read the page top to bottom. If it matches your question, use the online tool - or subscribe and run it on your own data.
A clear answer on what the method does and does not do, plus a live curve from our own demand series. Free to read.
1In one sentence: what it does
Splits the business journey from "someone sees you" to "someone pays you" into five steps, and shows you which step you fell off.
2When to use it
You are most likely in one of these three situations:
3What goes in · what comes out
Input: one platform, one piece of content, one string of numbers (this is the set used for the real run)
- Platform — Xiaohongshu
- Content title — Shanghai coffee shops: the traps to avoid
- Share of impressions that clicked through — 0.004
- Are impressions still growing — 0.9
- Share of clickers who watched to the end — 0.31
- Watch time as a share of the whole piece — 0.4
- Saves 0.008 / Comments 0.002 / Likes 0.01
- Direct messages asking 0.0 / Group joins 0.0 / Follows 0.003
- Shares 0.001 / Share of new people brought in 0.02
What comes out
Output: the raw run, as it came out (not a character changed)
Entry layer (do people who see it want to click through): 🔴 Lost | click ratio 0.004, impression growth 0.9
Catch layer (do the clickers want to watch to the end): 🔴 Lost | completion ratio 0.31, watch-time share 0.4
Engagement layer (do viewers want to act): 🔴 Lost | saves 0.008, comments 0.002, likes 0.01
Conversion layer (do they want to reach you): 🔴 Lost | direct messages 0.0, group joins 0.0, follows 0.003
Spread layer (will they pass it on for you): 🔴 Lost | shares 0.001, new people brought in 0.02

Break diagnosis: none (there is no "upper layer green, lower layer red" case)
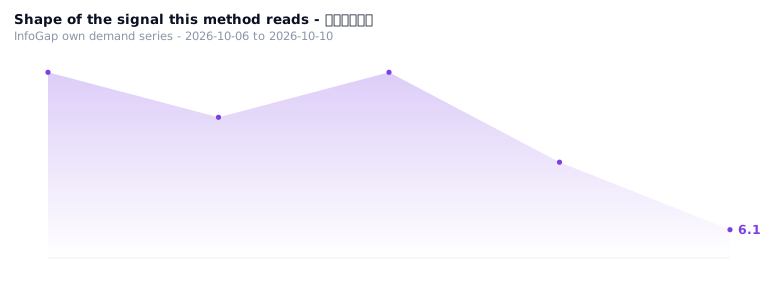
📈One picture: five steps, and which one people are stuck on
From seeing you to paying you there are five steps; see whether one of them is broken, or nothing was caught from the start.
4How to use it
There is no public calculator for this yet — the method above is the whole procedure; on this site the inputs have to be keyed in by hand.
- Collect the numbers your dashboard shows for each of the five steps
- Fill in what you can see (leave blank whatever you can't — it will not guess a number for you)
- See which layers come out red; only one red → fix that layer; all red → replace the content
5Who it is for
People already paying for traffic; shop owners who post content every day and get nobody asking; people who read other people's accounts for them.
6Common questions
7Related algorithms
✓Why this scenario exists (the evidence)
Why this scenario exists:
The overseas scouting report carries two real bills: ① $3.18 per thousand views, 612,000 impressions, $0.21 per click — $1,948 spent in total and not one lead; ② $700 bought back 180 clicks and 0 sign-ups.
The same report files this kind of practice under "looks cheap, is actually a trap": cheap creative + a cheap campaign objective = paying for noise.
Source: the site's ads-scout research report (ads-scout-20260921).